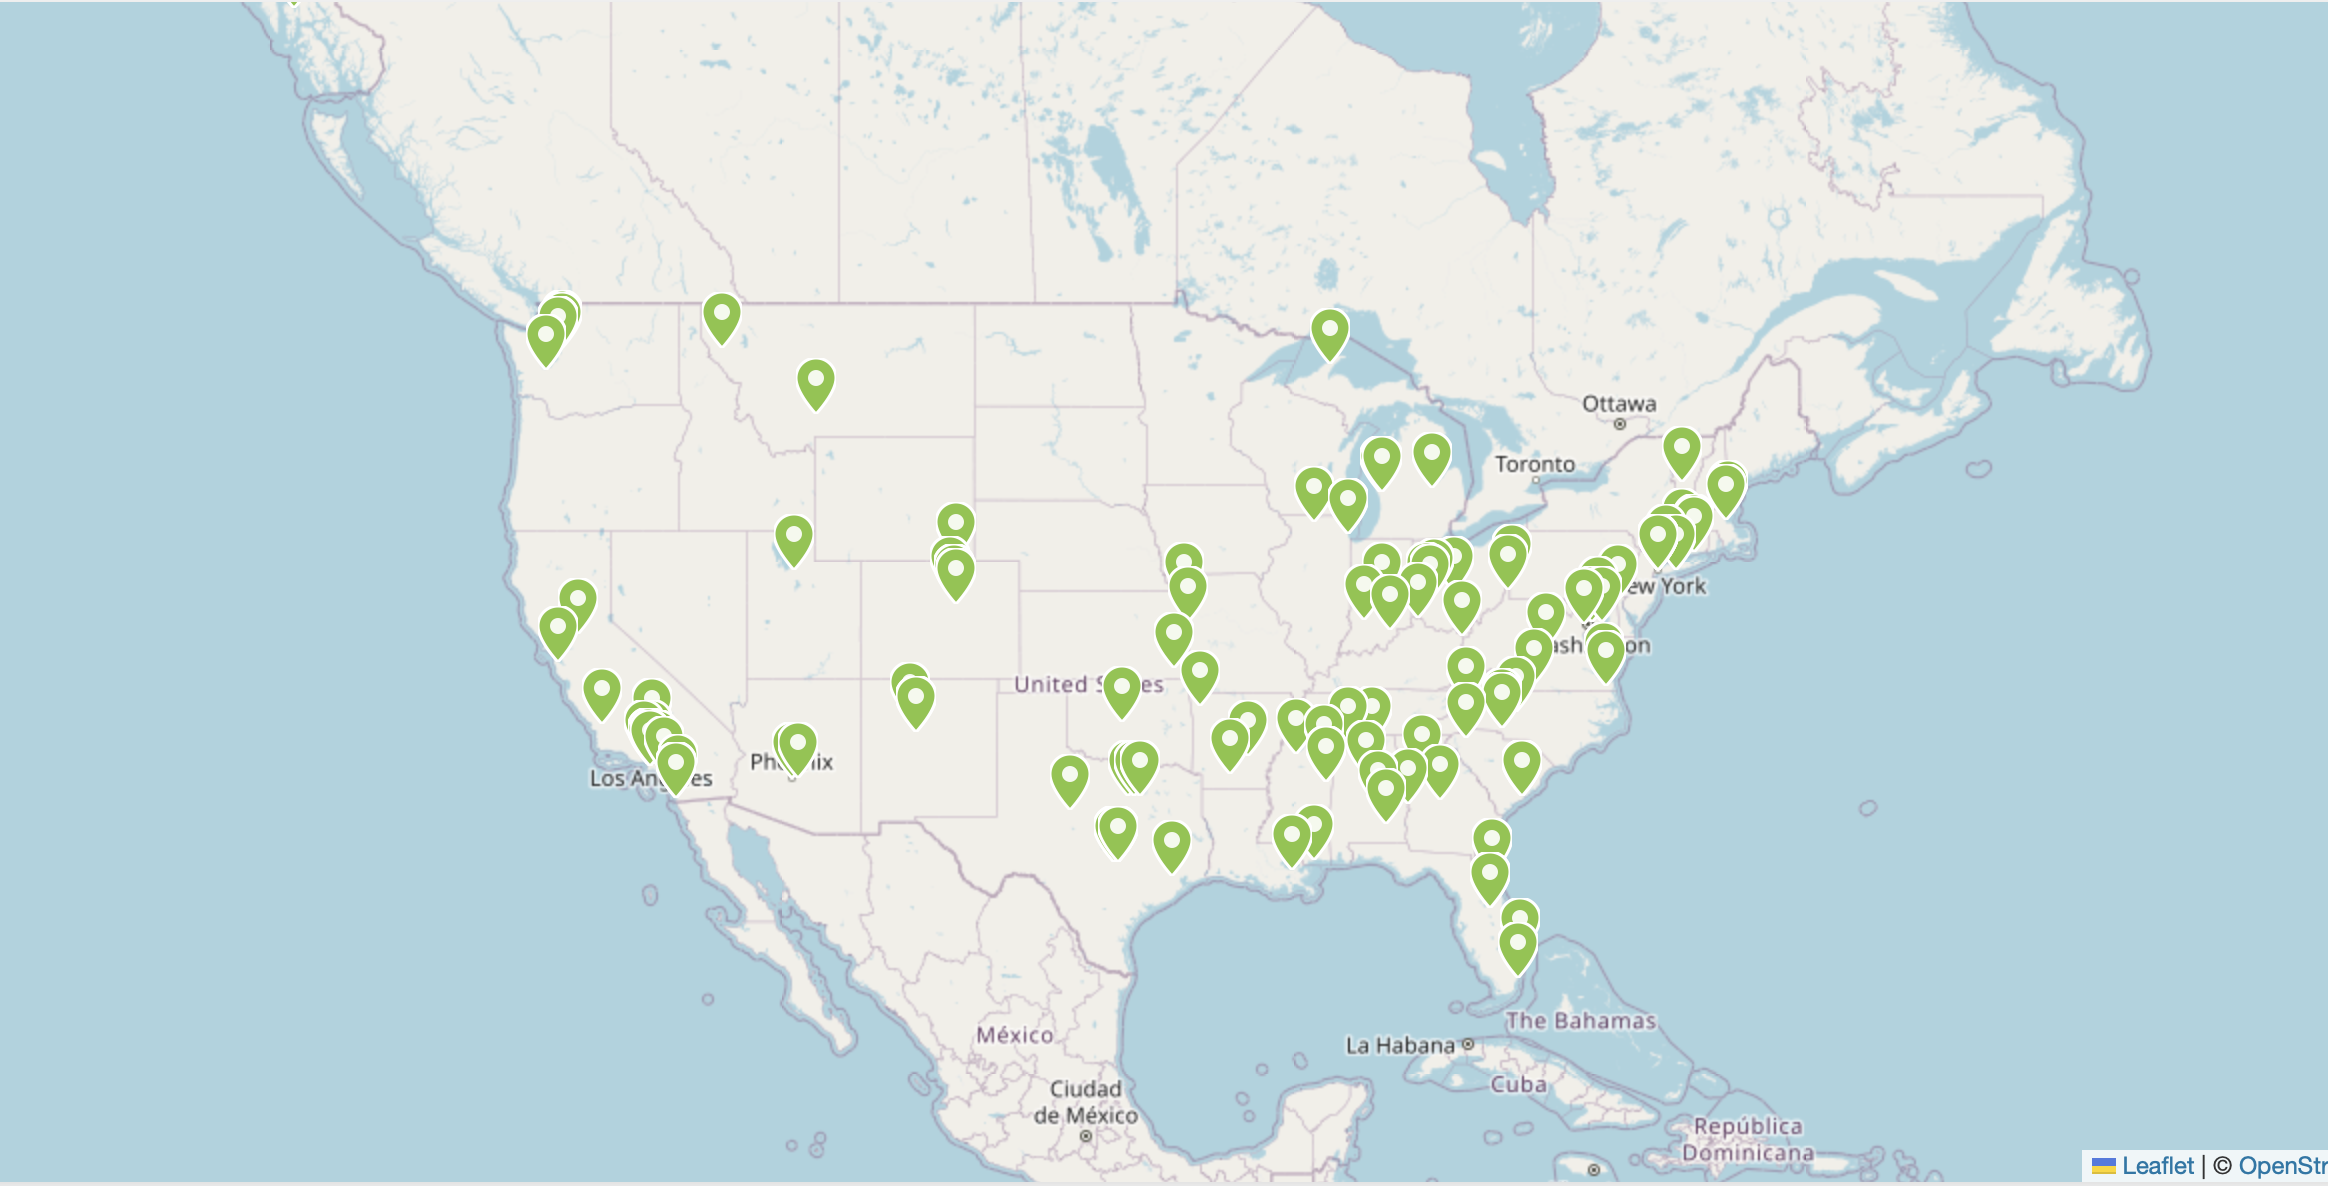
Interactive Map
See where defense capital is flowing
Deals plotted by location — U.S. states and congressional districts, plus a Europe view.
Explore the Map →
VC, PE, corporate and government-backed investment across the U.S. and allied defense sector.
View Deals17 indicators across capital flows, industrial base, and macro context.
View IndicatorsA personal research tool tracking the business environment for the U.S. and allied defense sector. Built to surface data that is publicly available but rarely aggregated in one place.
Federal Reserve Economic Data (FRED), Yahoo Finance, U.S. Census Bureau, and curated news intelligence from defense-sector publications.
Indicators cover 2019–present (monthly unless otherwise noted). Deal tracker and indicator data refresh automatically on a daily basis.
The U.S. defense industrial base, plus allied markets in Europe, Israel and the Asia-Pacific — about a third of tracked deals are outside the U.S. Economic indicators are U.S.-only. Excludes classified programs and government-to-government transfers.
Investment data is custom-compiled from public filings and reports. Macro indicators are sourced directly from official statistical releases with no adjustments.
AI Disclosure: This dashboard is created and updated with the assistance of AI. All claims should be verified using the linked sources.